Inline End-to-End Interface Testing in the eiConsole
With PilotFish, you’ll be more productive with end-to-end route testing and debugging directly within the application. There’s no extra hardware and no “wait time” for compilation and deployment. You’ll also benefit from full error logging and details at every stage. The eiConsole’s Testing Mode offers the same graphical environment and usability as the eiConsole which makes it just as intuitive and easy to use.
Point and Click Your Way to Testing and Debugging
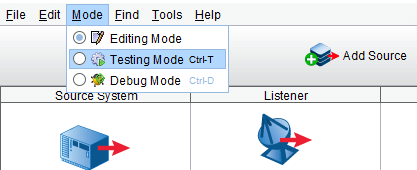
To enter Test Mode, begin by selecting the Route menu, then select the drop-down option “Switch to Testing Mode.” The testing module opens the menu where you can choose to either unit test any single stage or integration test any number of stages together.
When you first switch to Test Mode, the configuration icons are replaced by Question Mark icons to begin the process. Next, you would click the Question Mark for a selected Stage and then click “Start Test Here.” Then click the Stage where you want to end the test, or instead, you can opt to let the text run all the way through.
You can also easily connect to remote systems directly from the eiConsole to test the Transport connection, a huge convenience, and advantage of the eiConsole IDE.
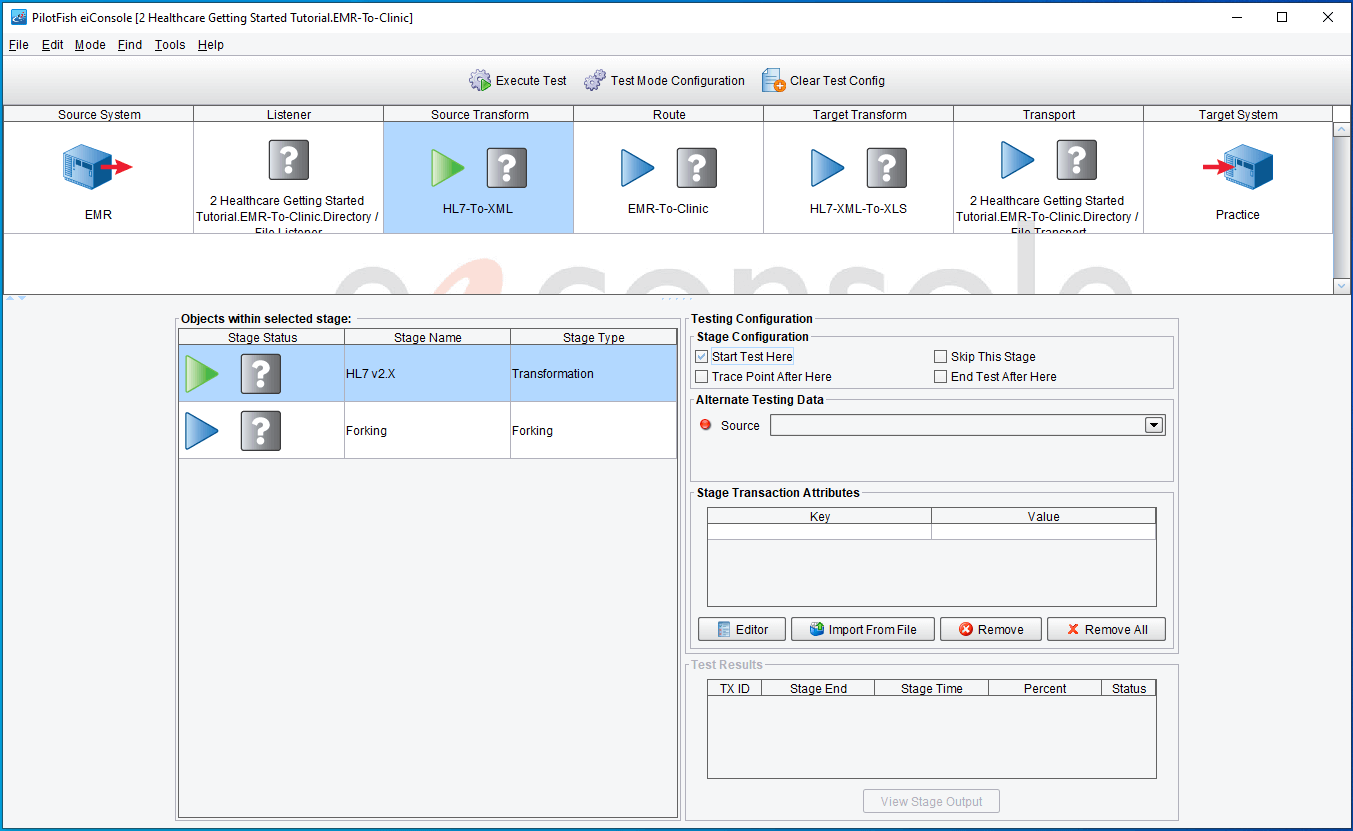
Click to enlarge
Click “Execute Test” when ready. At the end of the process, you will see the Question Mark Icon replaced with a Green Checkmark Icon for all the Stages that have run successfully, whereas the Question Mark icon will be with Red X Icon for stages that have failed. Failed stages provide detailed error messages allowing the failures to be quickly corrected and retested.
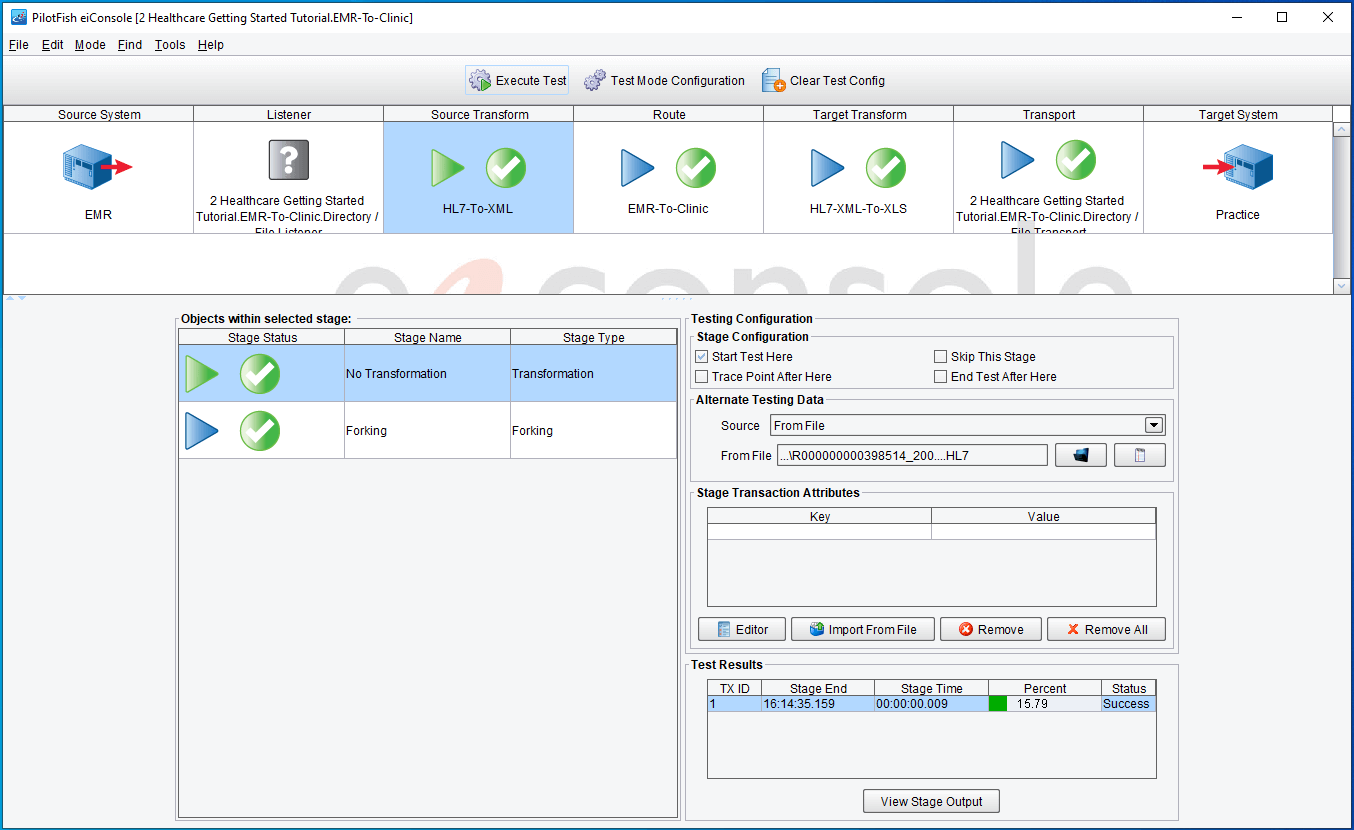
Click to enlarge
In Test Mode, you can also click on each Stage to see the output as the data undergoes the transformation and delivery process. For example, you can see the data in a flat file format transformed to generic XML, then to an HL7 health standard format (see example below), and then to the proprietary format of the Target. Or, you can see the result of your logical mapping onto an XML representation of an Excel workbook. In the testing mode, you can also see the XLS file itself. The eiConsole Test Mode gives you tremendous visibility and flexibility.
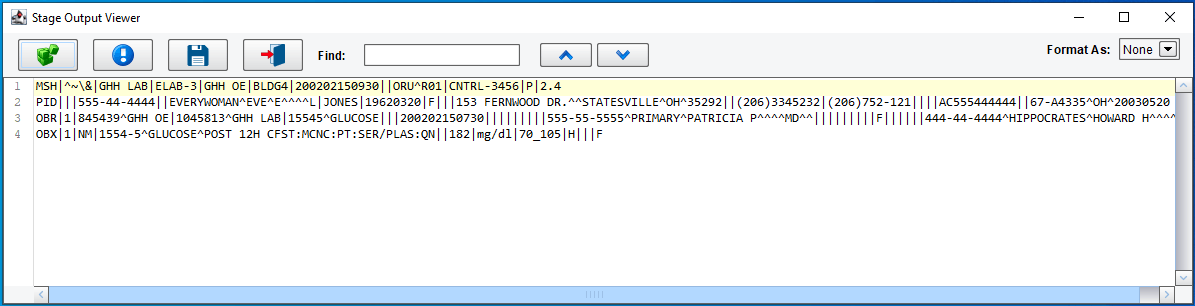
Click to enlarge
Deploy Your Configured Interfaces in Minutes on the eiPlatform!
Once an interface has been tested from end-to-end in the eiConsole, the final step is deployment to an eiPlatform run-time environment. Completed eiConsole interfaces are saved as a set of discrete, easily shared and easily managed configuration files.
Promotion of these interfaces can be achieved by just copying the files to the desired environment, or directly, with a few clicks through the eiConsole Route File Management’s point-and-click synchronization to an eiPlatform server.
The eiConsole IDE’s Test Mode is just one component of PilotFish’s comprehensive solution for interface development, maintenance, and management. Learn more about the eiConsole for Healthcare IDE.
The eiConsole for Healthcare Interface Engine is part of the PilotFish Interface Development Life Cycle – a complete system for building, maintaining, testing and deploying interfaces.
If you’re curious about the software features, free trial, or even a demo – we’re ready to answer any and all questions. Please call 813 864 8662 or click the link button.
HL7 is the registered trademark of Health Level Seven International.