A RESTful-Based, Real-Time Operational Reporting & Management Dashboard for Your Interfaces
PilotFish’s web UI delivers multi-dimensional operational insight for greatly reduced downtime and issue resolution on the fly. Users get to view interface activity, from high-level message orchestrations all the way down to discrete operations. Developers gain access to fix issues on the fly. Business users are provided with the kind of operational detail that enables them to troubleshoot and resolve issues at a greater speed, and far more efficiently than was previously possible.
eiDashboard users gain the ability to search, report and review any piece of data, from any message, at any time, in real-time. eiDashboard benefits include:
- Where other systems provide basic web-based log and status views, PilotFish provides a multi-dimensional view of interface activity
- Capabilities from high-level message orchestrations to discrete operations are made available at every level of abstraction
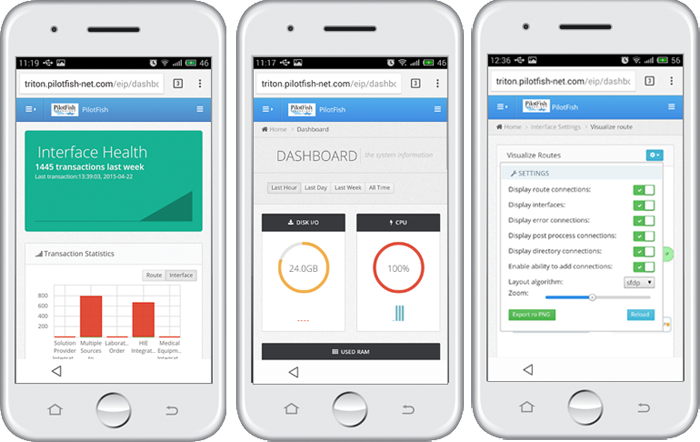
Monitor the Health of your Interfaces at Your Desk or on Your Mobile!
PilotFish’s eiDashboard utilizes a REST-based API for all operational reporting and control capabilities. Other systems only allow such access through a proprietary user interface which makes bundling these systems with other software, equipment, or services much more difficult due to an inconsistent user experience. PilotFish’s eiDashboard REST-based API now makes it possible for solution providers to integrate eiDashboard features right within their own applications. It provides a very unique value-add to other applications.
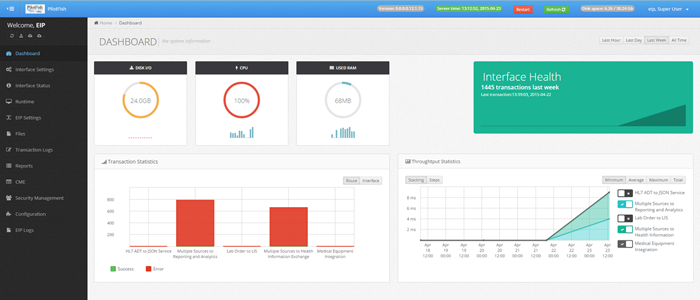
The Dashboard Overview page (above) presents a consolidated view of system performance (CPU, disk, and memory), overall interface health, and summary statistics of interface throughput and error rates.
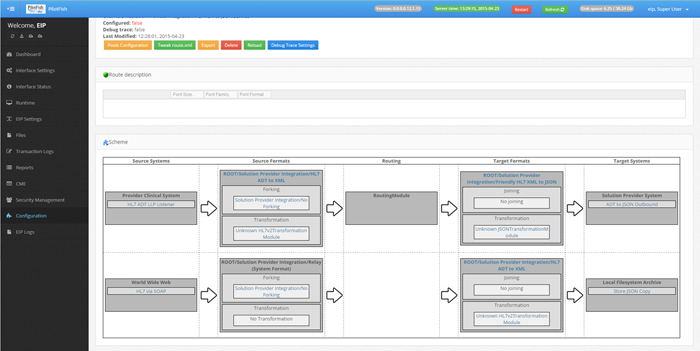
The Route Edit page (above) allows for on-the-fly changes to the settings of all interface components. (Within the eiConsole, a Route is an interface or a part of the interface.)
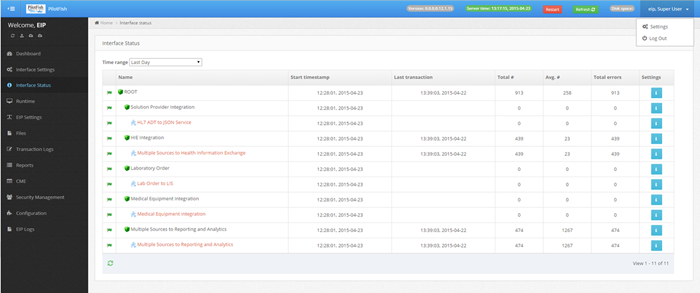
The Interface Status page (above) shows the health of the interfaces based on user-configurable health rules. An unhealthy condition can be triggered if the processing time exceeds an upper limit, if the volume drops below an expected minimum or if a required external system goes offline.
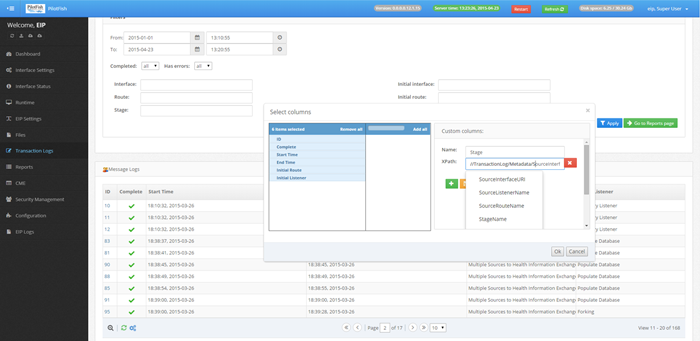
The Transaction Log page can be used to search for specific messages that have been processed and to view the contents of the message and its attributes as it progressed through every step of the interface.
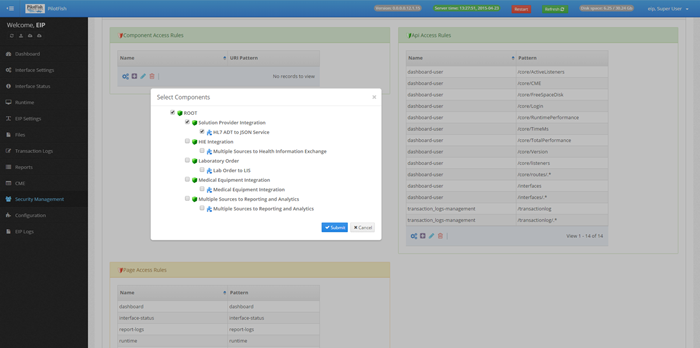
The Security Management (above) functionality can be used to set up users with access limited to specific functionality and to specific interfaces.
Advanced Reporting Capabilities in Real-time or Near Real-time
Standard, custom and ad hoc reporting is provided by the eiDashboard. The eiPlatform captures transaction data at its most granular level as it traverses the stages that comprise end-to-end interfaces or process orchestrations and writes it to an H2 database. This data is available in real-time or near real-time to the eiDashboard through a RESTful API, documented in Swagger. The eiDashboard, using a relational database can produce various reports and graphs for Operational Monitoring, Business Activity Monitoring, Business Intelligence and additional integration with popular “Commercial Off the Shelf” (COTS) analytics platforms.
The eiDashboard is an add-on component to the eiPlatform Interface Engine. Learn more about the eiPlatform Interface Engine (Java Runtime) and the eiConsole for Healthcare (Interface Engine IDE).
Contact us to learn more about how you can bundle our solution with your application, device or equipment. Ask us about our Value Added Reseller program, too.
eiDashboard Frequently Asked Questions
Yes, PilotFish supports configurable user access levels within different environments through its web-based monitoring tool, the eiDashboard.
The PilotFish audit trail feature includes configurable message archiving. Additionally, the eiDashboard supports detailed logging and enables users to resubmit messages after resolving any issues, enhancing traceability and operational recovery.
Yes! The PilotFish dashboard has been designed with users in mind, enabling them to trace and access associated files or transactions based on specific metadata or attributes. If the necessary metadata is tagged appropriately, users can easily view the correlated files.
Yes, PilotFish’s eiSuite, which includes the eiDashboard, delivers web-based analytics and reporting on various aspects of data integration, including documents, errors, and transaction volumes. It also allows monitoring and analyzing the documents that pass through the integration engine. This includes tracking the number of documents, types of documents and any transformations or routing.
Users can monitor resource usage in the PilotFish system by utilizing the eiDashboard, which provides detailed usage metrics.
The eiDashboard provides a built-in H2 database to manage historical data and support short-term data retention when an external database is not available and options for configuring data retention according to a client’s requirements.
Check out our FAQ pages for more.
If you’re curious about the software features, free trial, or even a demo – we’re ready to answer any and all questions. Please call 813 864 8662 or click the button.
HL7 is the registered trademark of Health Level Seven International.


