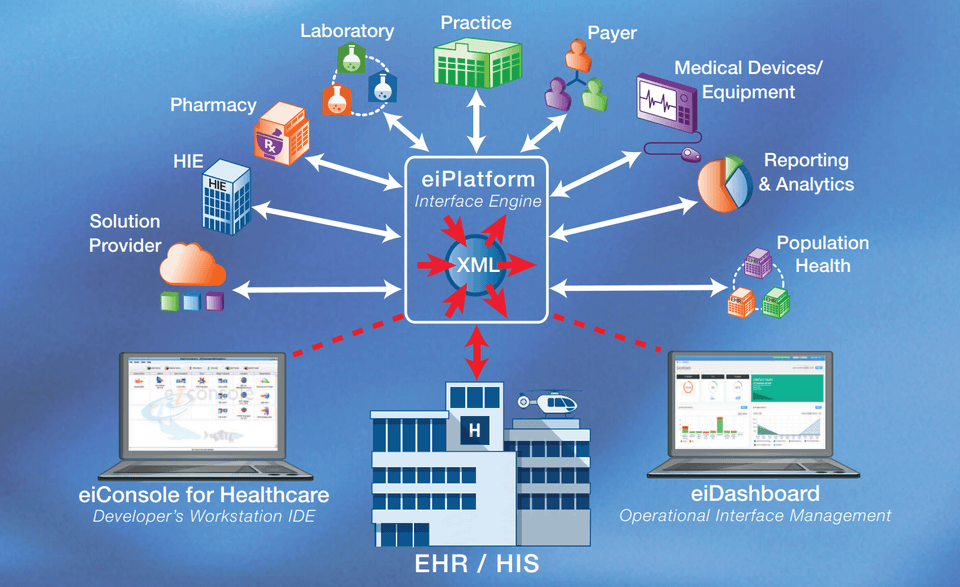
EHR / HIS Integration – an Evolving and Challenging Integration Environment
The approach to EHR data integration continues to vary greatly between health systems. Evolving integration capabilities among EHR vendors means an ever-changing ecosystem of data formats and connectivity methods, leaving little consistency for an integration approach. With PilotFish’s vendor-agnostic platform, solution providers have the capability to streamline an otherwise challenging process and exchange data with any system that can send and receive data, regardless of format.
Why do solution providers select PilotFish? Simply put, ease-of-use. PilotFish provides a component-driven solution that automates the entire process of configuring, managing and maintaining interfaces. This solution, using a consistent, repeatable and self-documenting assembly line process, vastly speeds up implementations and enables solution providers to make their offering instantly “interop-capable” out-of-the-box.
Is Your Integration Solution up to the Task?
Solution providers have unique requirements which cannot be solved with cookie-cutter solutions. That’s why PilotFish has architected its solution to be highly flexible and infinitely extensible. Adding support for new requirements, whether to support a new standard, communications protocol or new workflow is accomplished often in as little as a few hours.
PilotFish makes it easy by automating the entire integration process. Dozens of built-in adaptors allow for establishing connectivity by simply filling in a few fields. Built-in transformation modules and format builders allow for instantly reading in data from a proprietary format or one exported by a Source system. Perform compression, encryption, authentication, etc. with over 100 built-in processors. Other productivity-enhancing features include:
• Adeptly handling not only large batch-oriented data and HL7 2.x messaging, but highly conversational interactions with RESTful APIs, such as FHIR services.
• The ability to leverage a “lenient” HL7 2.x parser capable of immediately ingesting virtually any version or interpretation of an HL7 message (meaning no more cumbersome modeling of messages).
• For those EMRs offering lightweight, RESTful APIs, PilotFish’s new and novel API XL architecture is a means to encapsulate entire API-driven business processes.
• A template-based approach (with graphical data mapping for those utilizing CCDs or other complex XML formats) for dramatic improvements in productivity over solutions requiring scripting, coding or drawing “spider webs” of interconnecting lines between fields.
• A component-driven architecture where each component and individual mapping can be duplicated, tweaked in minutes and used to speed-up creating new interfaces.
Due to the ease-of-use of PilotFish, solution providers can utilize non-developers for 80-90% of the interface work, thus freeing-up scarce IT talent for other projects.
The PilotFish Interface Engine Solution Suite includes:
1. The eiPlatform (Interface Engine)
The PilotFish eiPlatform is a high-performance Interface Engine utilizing a Java-based framework which is:
- Flexible – you can expose both modern (e.g., API, web services) and legacy endpoints and data formats.
- Modular – each step in the “assembly line” (listeners, processors, transformations, etc.) are extensible and pluggable.
- Compatible – PilotFish supports all of the popular application servers, operating systems and platforms, so it is certain to work within your IT infrastructure.
- Versatile – it can be deployed on a virtual machine, on the cloud, standalone, clustered or using a federated model.
- Performant – often handling hundreds of messages per second and/or multi-gigabyte batch payloads on modest computing power.
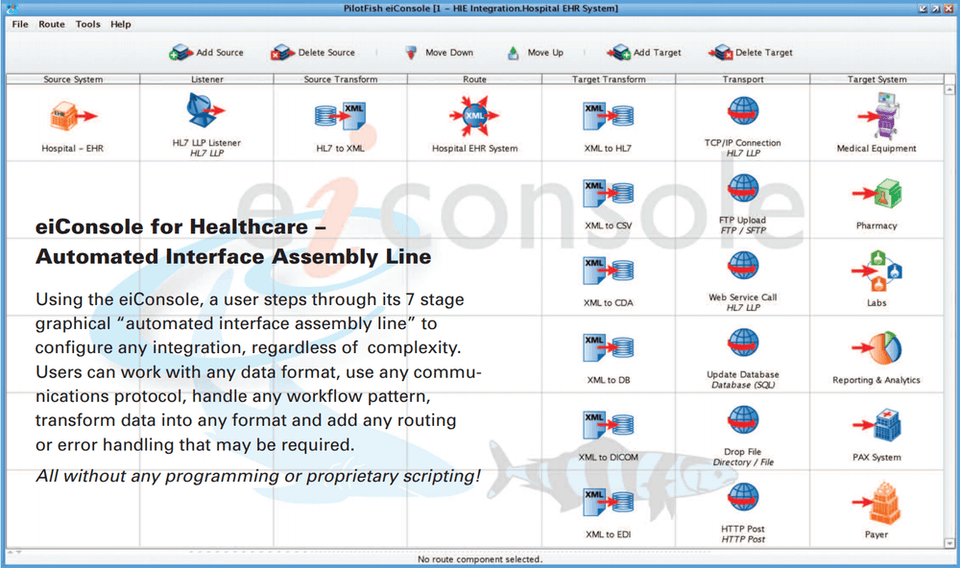
2. The eiConsole for Healthcare (Interface Engine IDE)
An integrated development environment designed for developers and non-technical resources to build, manage and maintain interfaces using a consistent and configurable, graphical “automated interface assembly line”. The eiConsole:
- Utilizes W3C standards instead of proprietary technology thus allowing you to hire from a large pool of available resources, not just those trained on specific engines.
- Offers extreme flexibility as it was designed to work with any data format including HL7 2.x, EDI, XLS, CSV, flat files, JSON, DICOM as well as XML standards such as HL7 3.x, CCDA, and FHIR (easily extended to support new standards as they are widely adopted).
- Is self-documenting and standardizes interface development for easy knowledge transfer between resources. Eliminates dependencies on that “one guy who built it”.
- Allows capable teams to be trained to high levels of efficiency in days and adds accessibility to non-technical staff. Most interfacing work can be offloaded from engineers to those that understand the business side of the data.
- Dramatically enhances traditional HL7 2.x interface development through a collection of innovations, including a:
- Lenient HL7 parser that can read in any HL7 2.x message whether it conforms to the standard or not.
- HL7 Differencing Engine that can mediate the differences between slightly variant HL7 2.x implementations.
- “Friendly Names” option that allows any HL7 message to be transformed into a human-readable XML representation at a click of a button.
Automation Makes eiConsole Users More Productive
The eiConsole is also designed to make users more productive with features that automate interface creation (leverage configuration versus coding). Features include:
• Drop-down menus to select from a list of built-in connectors that establish connectivity with source and target systems
• Built-in transformation modules and format readers to read in and work with data instantly
• Pre-built modules that support common workflow patterns typical to more complex business process modeling (BPM) scenarios
• Pre-built configuration panels to quickly set up Transaction Monitoring such as error reporting and logging
• An exclusive graphical data mapper with built-in transformation modules and format builders to automate building any mapping, no matter how complex, using drag & drop (no scripting required)
• Automated testing with an inline end-to-end graphical testing tool – start and stop at any stage, view output and any errors (saving hundreds of hours)
Our Customers Have Live Automat Integrations With
| Accuro (QHR) | Juno EHR | OpenEMR |
| Allscripts | KinLogix | OSCAREMR |
| Amazing Charts | Max-Gold | Patcom |
| CareCloud | McKesson | PointClick Care |
| Cerner | McKesson Star | Practice Fusion |
| Charstar | Medesync EMR | Purkinje |
| CIS Base | MEDHOST | Siemens Soarian |
| Code-Med | Medigold Health | SigmaCare |
| CPSI | MEDITECH | Sunquest |
| eClinicalWorks | MediTouch | Toubib |
| Epic | MYLE | WebPAS |
| GE Centricity | NextGen | YorkMed |
| Greenway Health | Nightingale EHR | |
| Healthscreen | OmniMD |
3. The eiDashboard (Operational Interface Management)
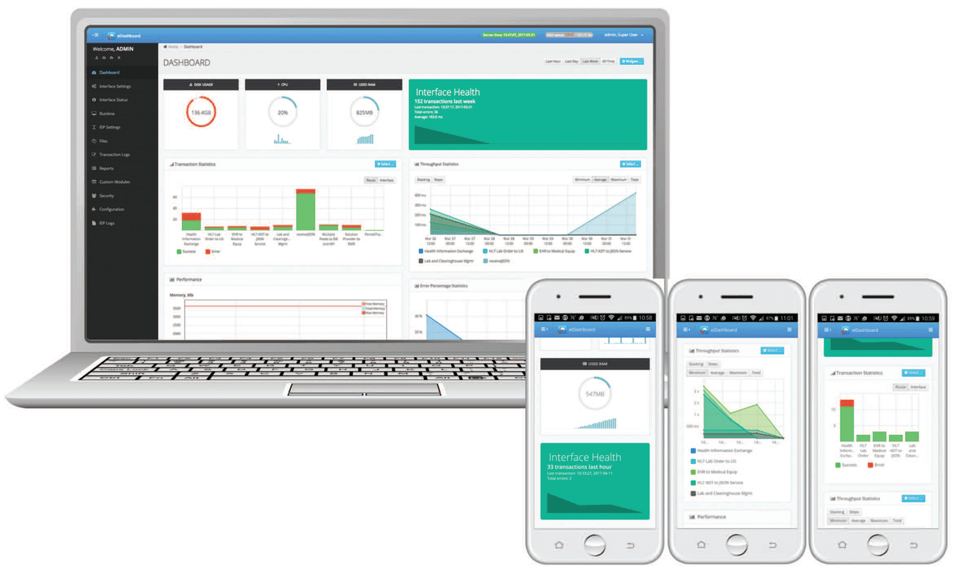
Take control and graphically monitor and manage your interfaces with the eiDashboard. This browser-based application can be used on any desktop or smart device with network access, thereby giving you 24/7 visibility. With the eiDashboard, you:
- Can make better and faster decisions with a consolidated view of system performance, overall interface health, operational statistics and throughput, error rates and much, much more.
- Get to view and act on detailed interface activity from high-level message orchestrations all the way down to discrete transaction details specific to each stage of processing.
- Examine throughput during any time interval to determine when activity is highest so that hardware resources can be properly allocated to better manage the load.
- Gain insight by being able to view the total number of transactions for the selected time frame per route or interface to quickly identify which routes are causing errors and may need to be modified.
- Monitor the health of any interface based on customized “health rules” which can define expected volume thresholds (low and high), acceptable failure rates and performance/service level expectations.